

- Paradoxically, low-risk stocks historically have outperformed higher-risk stocks over the long run.
- They outperformed due to the behavioral biases of investors.
- Dr. Daniel Crosby, behavioral finance expert, has devised a three-part test (The Crosby Test) to determine if an investable idea has the potential to persist. The criteria are:
- The idea must be sensible.
- The idea must be empirically robust.
- The idea must be psychologically or physically hard to execute.
- Low-volatility investing fits all three of these criteria.
First, a quick recap of what low-volatility investing is. Low-volatility investors purchase a basket of stocks that demonstrate lower volatility (up and down movement of price) than the overall market. Low-volatility investing has been described as an “anomaly” because it goes against both academic consensus and common sense that “high risk” should be rewarded with “high returns.” Low-volatility seems to defy that rule. Over long periods of time, it has historically been shown that low-risk stocks seem to outperform their high-risk counterparts.
One explanation of why this anomaly has persisted is because the behavioral biases of investors. Pim van Vliet, a low-volatility equity manager in the Netherlands, offers the explanation that low-volatility works because it’s so boring that most investors can’t stick with it long enough to realize the benefits. Additionally, fund managers are hesitant to use low-volatility because of tracking error – the strategy tends to fall behind the benchmark during periods of growth. It generally makes up for lost time during downturns.
Does the low-volatility anomaly have the potential to persist?
Dr. Daniel Crosby, a behavioral finance expert, has devised three criteria to determine if an investment anomaly created by investor behavior may continue to persist. I call it “The Crosby Test.” Let’s see if low-volatility investing fits the criteria.
The Crosby Test
- Is the idea sensible?
- Is it empirically robust?
- Is it psychologically or physically hard to execute?
Is it sensible?
Yes.
Despite making us question the traditional relationship between risk and reward, low volatility is sensible. By reducing the severity of downside risk, low-volatility strategies have smaller holes to dig themselves out of when the market recovers. During periods of turmoil, low-volatility tends to outperform by losing less.
Is it empirically robust?
Yes.
Pim van Vliet has tested the low-volatility anomaly in the United States going back to 1929 (link to his dataset (http://www.paradoxinvesting.com). Often a strategy that works in the US does not work in other markets. However, Pim van Vliet has shown that this anomaly shows up in Japan (tested to 1985), Europe (tested to 1985), and Emerging Markets (tested to 1993).
Is it psychologically hard to execute?
Yes.
For low-volatility investing, the psychological aspect is how the magic happens. If everyone piled into a strategy, it would stop working. Fortunately, few investors jump into low-volatility. You may be asking “If get can get higher returns with lower risk? What’s not to love?” Well, a lot of it isn’t very loveable… and that’s why it has worked in the past…
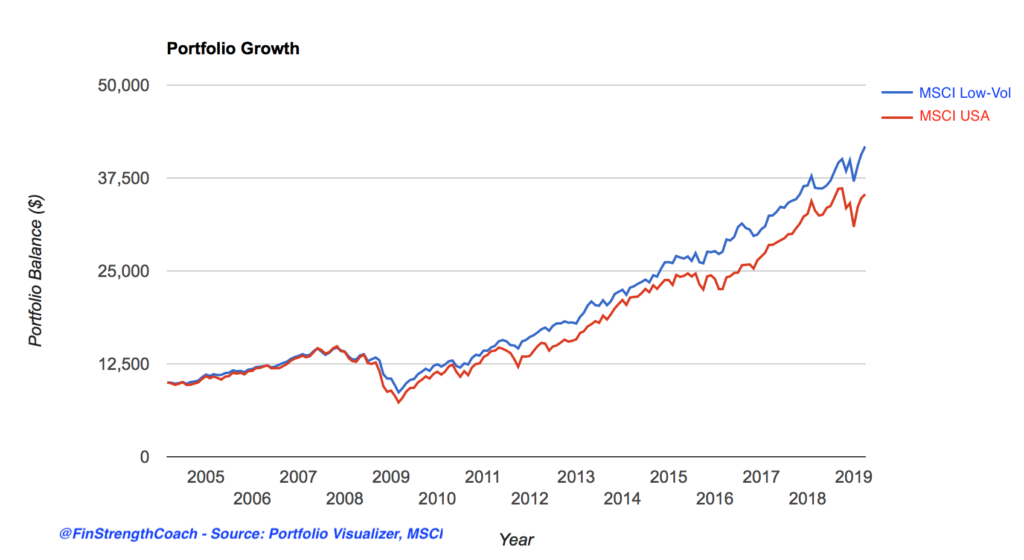
Looking at this chart from March 2004 to March 2019, its fairly clear that low-volatility (represented by the MSCI USA Minimum Volatility Index) out-performed the general market (represented by the MSCI USA Equity index). Looks good, right?
However, things look a bit rougher once we zoom in on the data.
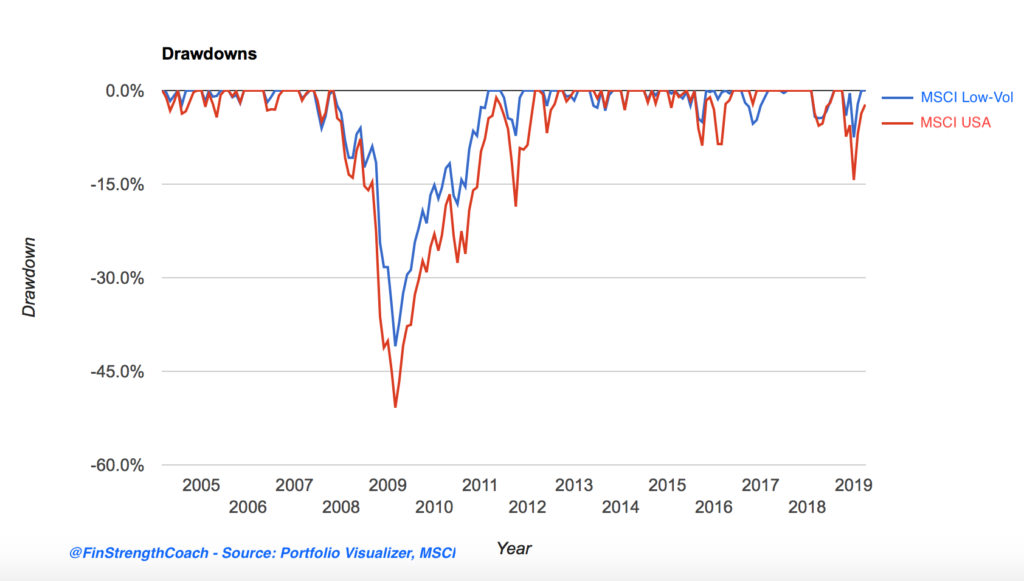
Low-volatility achieves much of its outperformance by doing “less bad” than the market during down turns. During the financial crisis, the MSCI Low-Vol drawdown was 41%… quite a bit less than the 51% drop of the general market. That’s great by comparison, but it’s hard to get excited about a 41% drop in value.
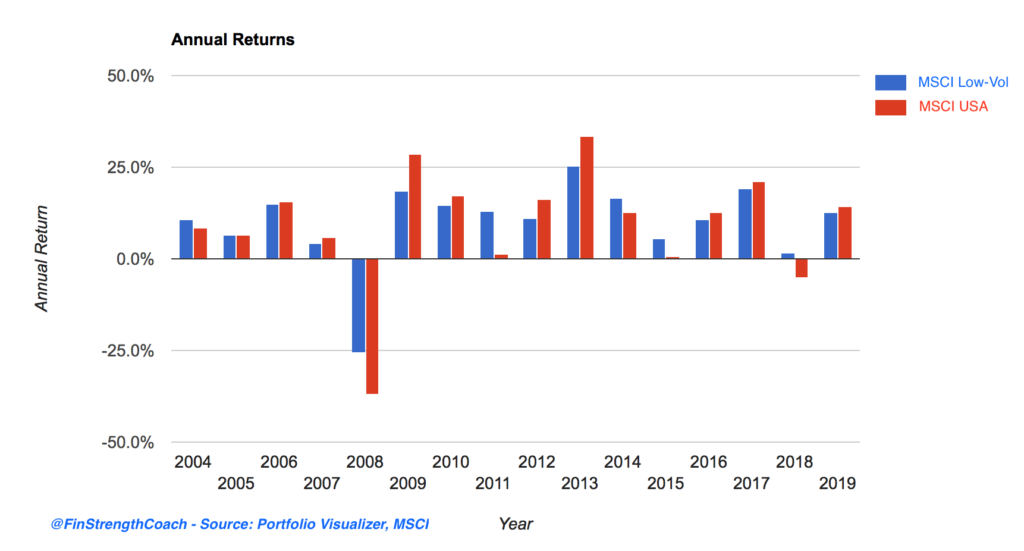
Additionally, low-volatility tends to lag the market during periods of growth. Low-volatility lagged the market 9 out of the 15 years represented in this chart, or 60% of the time. Again, it’s very difficult to get excited when your strategy is underperforming its peers 60% of the time. In 2013, low-volatility investors likely questioned their strategy when they saw a return of 25% vs their peers with a return of 33% for the year.
So yes, the strategy is quite difficult to execute from a psychological perspective. It takes an entire market cycle for the strategy to bear fruit. Unfortunately, most investors don’t have the stomach to wait that long… which is why this strategy has seemed to persist since 1929.
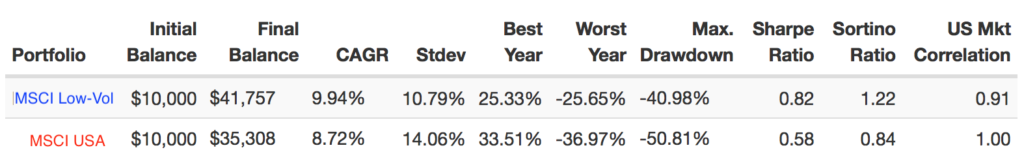
This is a hypothetical example and is for illustrative purposes only. No specific investments were used in this example. Actual results will vary. Past performance does not guarantee future results.
Investments are subject to risk, including the loss of principal. Because investment return and principal value fluctuate, shares may be worth more or less than their original value. Some investments are not suitable for all investors, and there is no guarantee that any investment goal will be met. Past performance is no guarantee of future results. Talk to your financial advisor before making any investing decisions.
